Visualization tool tracks COVID-19
How does where I live compare with other regions in reports of COVID-19 infections and deaths? When should we expect our region to start “flattening its curve,” or showing declines in the number of COVID-19 cases?
NC State analytics experts Christopher Healey and Susan Simmons built a visualization dashboard using publicly available data that shows these comparisons and predictions.
Healey, an NC State professor of computer science and Goodnight Distinguished Professor at the university’s Institute for Advanced Analytics, says that he and Simmons, a teaching professor at the Institute for Advanced Analytics, built the dashboard to provide information that is hard to find elsewhere.
They focused on exploration and prediction – properties that visualization and analytics are well suited to provide.
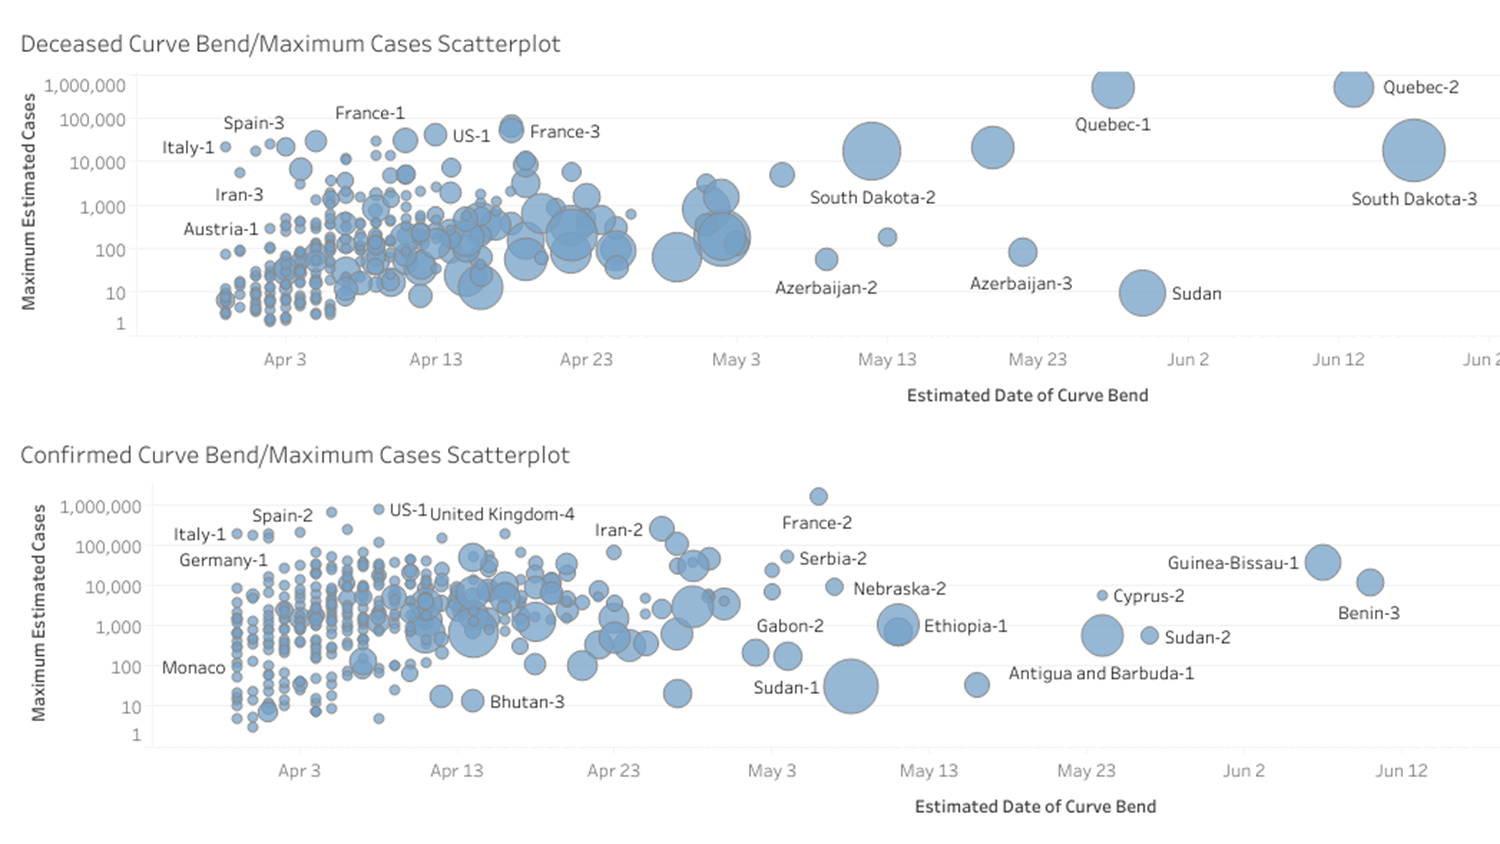
Perhaps most interestingly, the dashboard predicts the flattening in a region’s outbreak curve for both confirmed COVID-19 cases and for COVID-19 fatalities.
The dashboard also provides region-to-region comparisons of confirmed COVID-19 cases and fatalities. Users can compare different U.S. states or entire countries. Some larger countries are separated into regions for further context and specificity.
To provide additional context, the dashboard also includes case count and map visualizations.
The dashboard is updated daily as new numbers are made available. The researchers use data.world’s Coronavirus (COVID-19) Case Counts site, which requires a free user account to access.
-kulikowski-
This post was originally published in NC State News.
- Categories: